"Trend Confirmation (Short/Long)"
"1 Minute Scalping Indicator"
"Tradingview Supporting Indicator"
What is Trend Looper (Tradingivew)
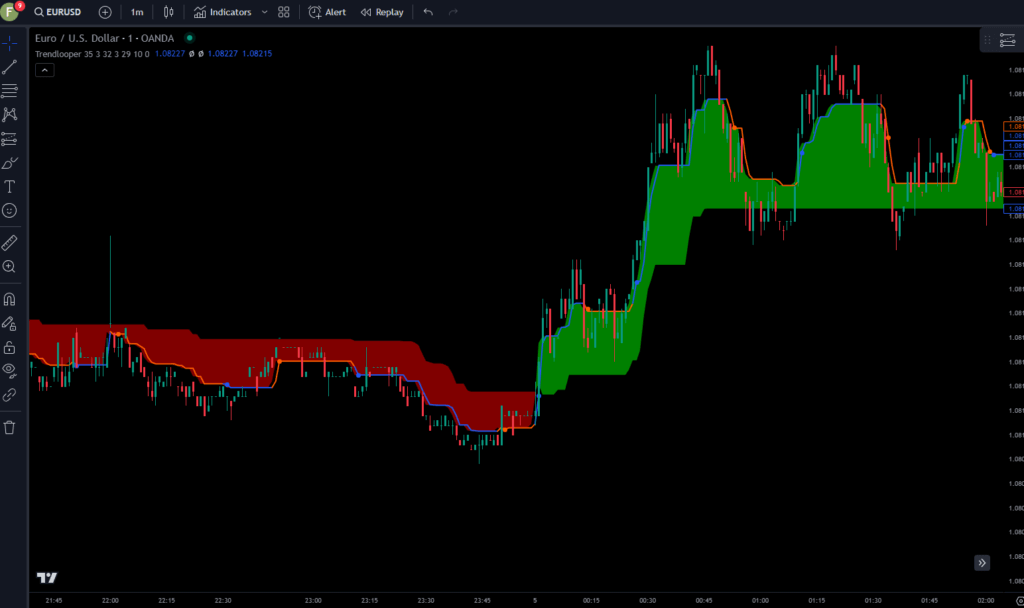
The Trendlooper indicator provides a comprehensive method, of analyzing market trends by combining elements from the Ichimoku Cloud. Traders can make more informed decisions by understanding each script component and how they interact. Whether you are a novice or an experienced trader, this custom indicator can be a valuable addition to your toolkit.
How to Use the Trendlooper Indicator on TradingView
Step-by-Step Guide
- Add the Script to Your Chart
-
- Open TradingView and navigate to a chart of your choice.
- Click on the "Pine Editor" tab at the bottom of the page.
- Copy and paste the Trendlooper script into the Pine Editor.
- Click "Add to Chart" to apply the script.
-
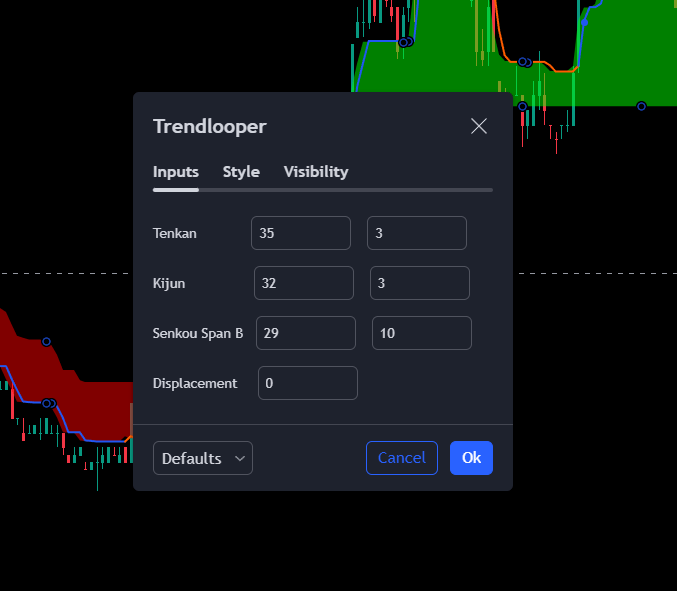
Customize Input Parameters
- The script allows the customization of this settings:
- Tenkan-Sen (Conversion Line)
- tenkan_len: The period length for Tenkan-Sen.
- tenkan_mult: The multiplier for ATR calculation in Tenkan-Sen.
- Kijun-Sen (Base Line)
- kijun_len: The period length for Kijun-Sen.
- kijun_mult: The multiplier for ATR calculation in Kijun-Sen.
- Senkou Span B
- spanB_len: The period length for Senkou Span B.
- spanB_mult: The multiplier for ATR calculation in Senkou Span B.
- Displacement
- offset: The forward displacement for Senkou Span A and B.
- Tenkan-Sen (Conversion Line)
- The script allows the customization of this settings:
-
Interpreting the Indicator
-
Tenkan-Sen and Kijun-Sen
- These lines are used to identify short-term and medium-term trends.
- Crossover Signals:
- Bullish Crossover: When Tenkan-Sen crosses above Kijun-Sen, it suggests a potential buy signal.
- Bearish Crossunder: When Tenkan-Sen crosses below Kijun-Sen, it suggests a potential sell signal.
-
Senkou Span A and B (Cloud)
- The area between Senkou Span A and Senkou Span B forms a cloud that helps identify future support and resistance levels.
- Cloud Color:
- Green Cloud: Indicates a bullish trend when Senkou Span A is above Senkou Span B.
- Red Cloud: Indicates a bearish trend when Senkou Span A is below Senkou Span B.
- Cloud Thickness: Thicker clouds indicate stronger support/resistance levels.
- Cloud Color:
-
Chikou Span (Lagging Line)
- Although hidden by default, Chikou Span can be enabled for additional confirmation.
- It helps identify the overall trend by comparing the current closing price with past prices.
-
-
Applying the Indicator in Trading
- Trend Identification: Use the color and position of the cloud to determine the overall trend. Trade in the direction of the trend for higher probability setups.
- Entry Points:
- Look for bullish crossovers (Tenkan-Sen above Kijun-Sen) to enter long positions.
- Look for bearish crossunders (Tenkan-Sen below Kijun-Sen) to enter short positions.
- Exit Points:
- Consider exiting long positions when a bearish crossunder occurs.
- Consider exiting short positions when a bullish crossover occurs.
- Support and Resistance: Use the cloud as dynamic support/resistance levels. Prices above the cloud indicate support, while prices below the cloud indicate resistance.
Tips on Trading Trend Looper
- Combining other Indicators: While Trendlooper is powerful, combining it with other indicators like RSI, MACD, or volume can provide additional confirmation and reduce false signals.
- Backtesting: Before using the indicator in live trading, backtest it on historical data to understand its performance under different market conditions.
- Adjusting Parameters: Fine-tune the input parameters based on your trading style and the specific asset you are trading. Different assets may respond better to various settings.
Example Trade Setup
-
Identify Trend:
- Check if the price is above or below the cloud to determine the overall trend.
-
Look for Crossovers:
- Wait for Tenkan-Sen to cross above Kijun-Sen for a bullish signal or below Kijun-Sen for a bearish signal.
-
Confirm with Colored Cloud:
- Ensure that the cloud color aligns with your trade direction (green for bullish, red for bearish).
-
Enter Trade:
- Enter a long position on a bullish crossover or a short position on a bearish crossunder.
-
Manage Trade:
- Use trailing stops or other risk management techniques to protect profits.
- Consider exiting when an opposite crossover occurs.
By following these steps and understanding how each component of the Trendlooper indicator works, you can enhance your trading strategy and make more informed decisions. Happy trading!