Best Trading Indicators for Any Conditions
Search for the "best" binary options indicator and you will find a hundred lists, each naming a different tool. The honest answer is that no indicator is best in the abstract. Every indicator measures one thing about price — direction, speed, or how stretched the market is — and each one shines in the conditions it was built for and struggles in the rest. A trend tool looks brilliant in a steady move and misleads you in a flat range; a momentum tool does the opposite. So the useful question is not "which indicator wins?" but "which few indicators, read together, describe what this market is actually doing right now?"
Below are four genuinely useful indicator categories, what each one measures, and how to read them without fooling yourself. If you want a ready-made arrow tool to study alongside these, the Binary FX Pro indicator is a beginner-friendly place to start on the one-minute market.
1. Moving Averages — trend direction
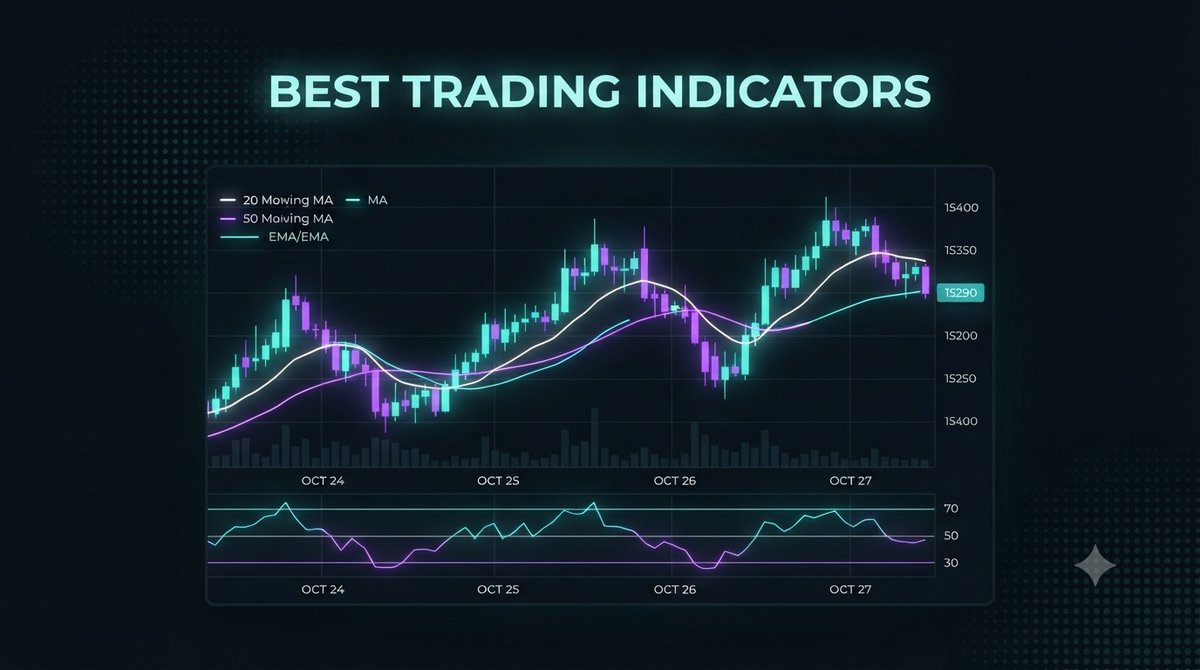
A moving average smooths price into a single line so you can see the underlying direction instead of every twitch. When price and a short average slope up together, the market is trending up; when they slope down, it is trending down. Many short-expiry traders favour faster exponential moving averages such as the 5 or 10 period because they react quickly to price. The trade-off is that a fast average also reacts to noise, so in a sideways market it will flip back and forth. Moving averages tell you direction, not timing.
2. RSI and Stochastic — momentum
Momentum oscillators measure how fast and how far price has moved, and they swing between fixed levels. The Relative Strength Index (RSI) and the Stochastic oscillator both flag when a move looks stretched: high readings suggest buyers may be tiring, low readings suggest sellers may be. That does not mean price reverses on cue — a strong trend can stay "overbought" for a long time. Read them as context, not as a countdown. Tools like the RSI Alert Indicator simply automate the moment those levels are reached so you are not staring at the chart all day.
3. Bollinger Bands and ATR — volatility
Volatility indicators describe how much the market is moving, which sets your expectations for a short expiry. Bollinger Bands wrap two bands around a moving average that widen when price is active and pinch together when it is quiet. Average True Range (ATR) does something similar as a single number. Neither predicts direction — they tell you whether a breakout is likely to run or fizzle. A quiet, pinched market often precedes a move; a very wide one is often near exhaustion. For a worked example, see the Bollinger MA indicator and the Expert Option Bollinger strategy.
4. MACD — trend and momentum together
MACD is popular because it blends two ideas: it uses moving averages to show direction and a histogram to show momentum building or fading. When the MACD line and its signal line agree with the histogram, direction and speed point the same way, which is a cleaner read than either signal alone. When they disagree, the market is undecided and the sensible move is to wait.
How to combine indicators without fooling yourself
The most common mistake is stacking indicators from the same family and calling it confirmation. Two moving averages, or RSI plus Stochastic, will usually say the same thing because they measure the same thing — that is agreement by design, not independent proof. Real confirmation comes from combining different categories: a trend tool for direction, a momentum tool for timing, and a volatility read for context. A few practical habits:
- Use two or three indicators at most. More lines mean more conflicting signals, not more clarity.
- Let each candle fully form before you act on an alert.
- When your indicators disagree, treat it as a "stand aside," not a coin flip.
- Risk a small, fixed fraction of your balance per trade and set a daily stop for the session.
- Test any combination on a demo account until the reads feel automatic before risking real funds.
No indicator removes losing trades. The goal of any of these tools is steady, repeatable decisions and trading with more consistency — not a shortcut around risk.
FAQ
Which single indicator is the best for binary options?
There is no single best indicator. Each one measures only direction, momentum, or volatility, so the strongest approach is combining a few from different categories that suit the conditions you trade. What matters more than the tool is disciplined risk management.
Do I need to pay for good indicators?
The core indicators covered here — moving averages, RSI, Stochastic, Bollinger Bands and MACD — are built into most trading platforms at no cost. Paid tools mainly package alerts and presets to save you time; every indicator on this site is included in a single $39 lifetime plan if you want them in one place.
How many indicators should I use at once?
Two or three is plenty. Adding more from the same family creates false confidence rather than real confirmation, and a cluttered chart is harder to read under the pressure of a short expiry.
This content is for educational purposes only. Trading involves risk. Past results do not guarantee future outcomes. Always practice responsible money management and limit your daily trades to avoid large losses.