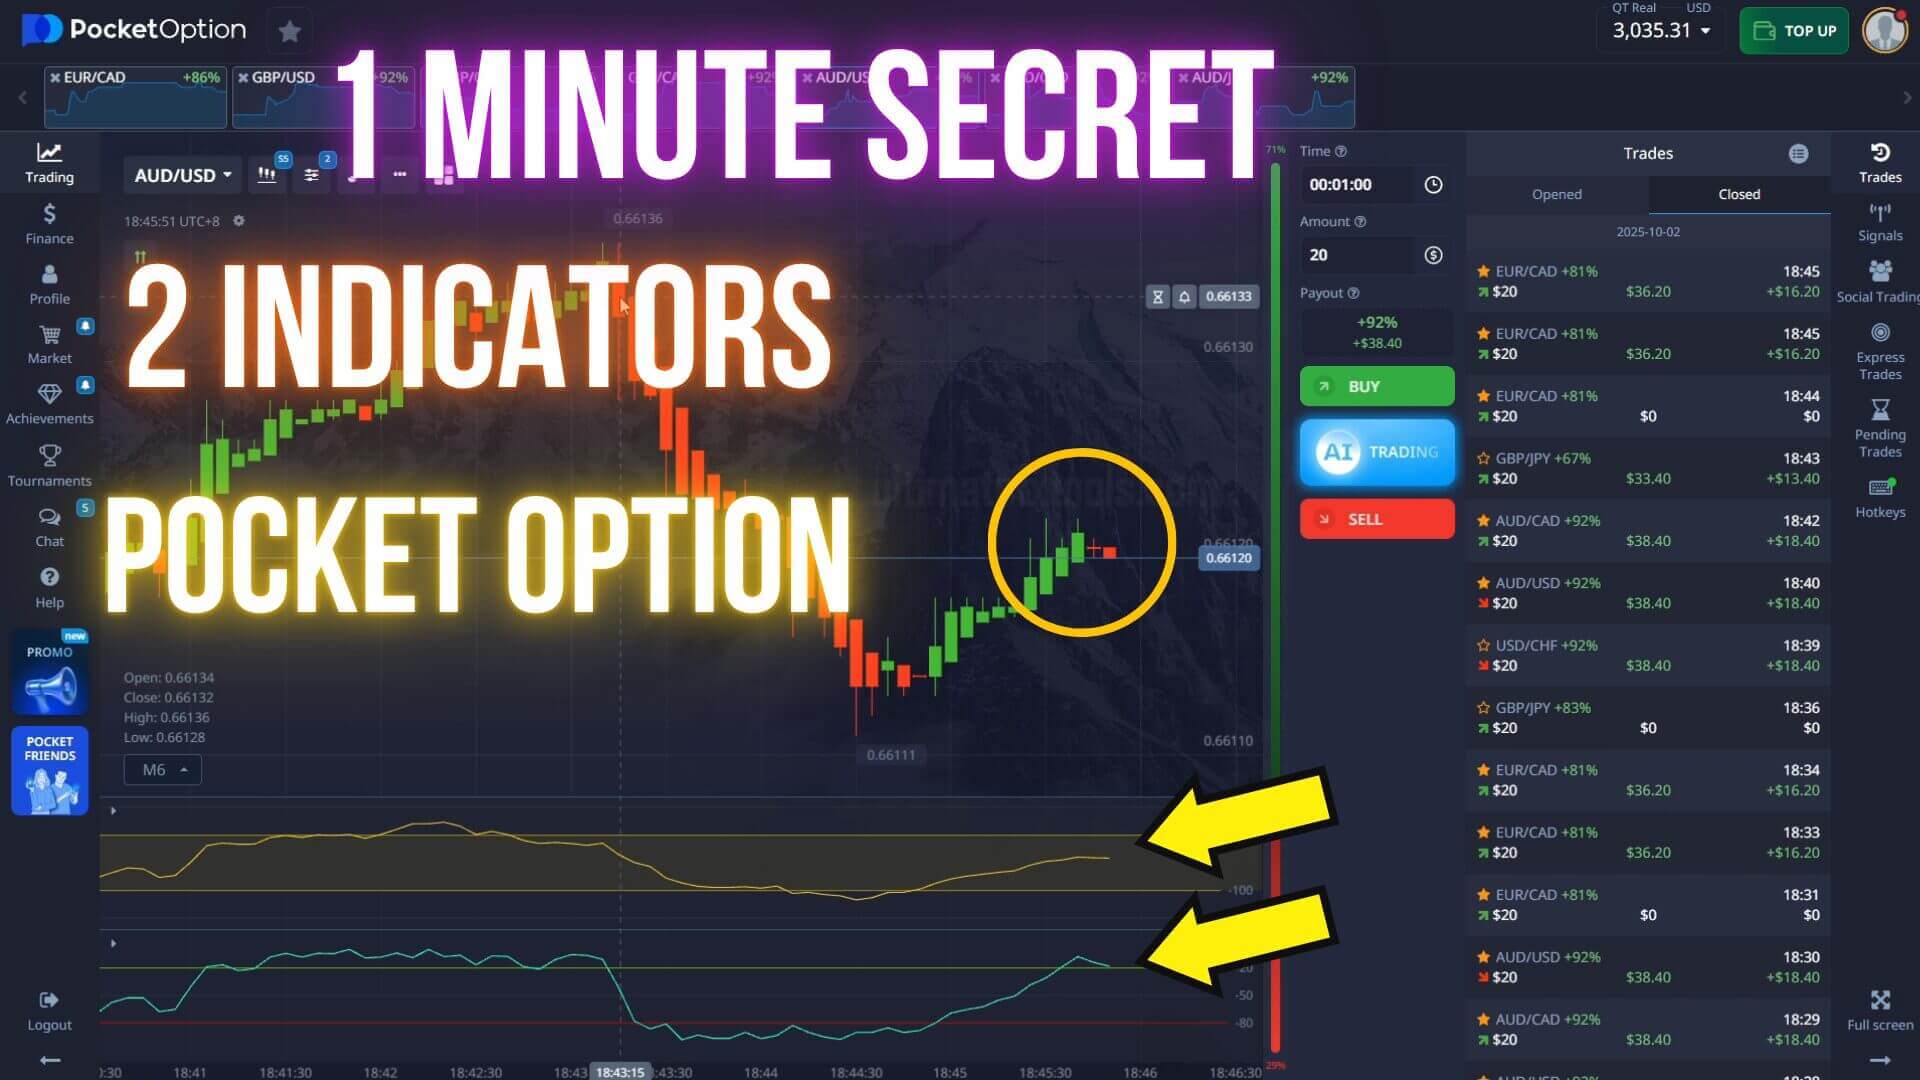
1 Minute CCI & Williams %R Reversal Pocket Option Strategy
The phrase "1 minute trick" is a nickname, not a loophole — nothing here beats the platform or removes losing trades. What it describes is a repeatable way to read a one-minute chart using two classic oscillators, the CCI and Williams %R, to flag moments when a short-term move may be running out of fuel. Below are the settings, the rules, and the weakness most versions never mention.
What Each Indicator Actually Measures
CCI compares the current typical price to its own moving average, scaled so most readings fall between −100 and +100; a push beyond ±100 marks an unusually stretched condition. Williams %R measures where the close sits inside the high–low range of its lookback period, from 0 at the top to −100 at the bottom — above −20 is conventionally called overbought, below −80 oversold. Both respond within a candle or two, which is why traders reach for them when the expiry is short.
The Honest Catch: Correlation Is Not Confluence
CCI and Williams %R are both momentum and overbought/oversold oscillators, and both are calculated from the same short window of recent price. When they agree, that agreement is largely a consequence of them measuring similar things — two thermometers in the same room will usually read the same number. It is a second view of the same evidence, not a second, independent piece of evidence. Calling it "dual confirmation" oversells what is really happening.
The practical consequence shows up in trends. During a sustained one-minute run, CCI can sit above +100 and Williams %R above −20 for many candles in a row while price simply keeps climbing. Both indicators agreeing on "overbought" in that moment is not a reversal signal — it is an accurate description of a strong trend. This pair gives its worst stretches in exactly the conditions that look most convincing, and no oscillator reading alone tells you which case you are in.
What an Independent Filter Adds
An independent filter measures something the two oscillators do not: direction or volatility. A trend filter — a moving average slope, or a tool like the one in this CCI and Super Trend approach — answers the question the oscillators cannot: are these range-bound conditions where a stretched reading tends to snap back, or a trend where it can stay stretched? A volatility filter such as ATR, applied in this ATR with Williams %R method, tells you whether the one-minute range is even large enough to be worth reading. The filter's job is to say no, and reading fewer setups with more context is what builds consistency.
Setup and Settings
Chart: the 1-minute timeframe with a 1-minute expiry. Standard settings:
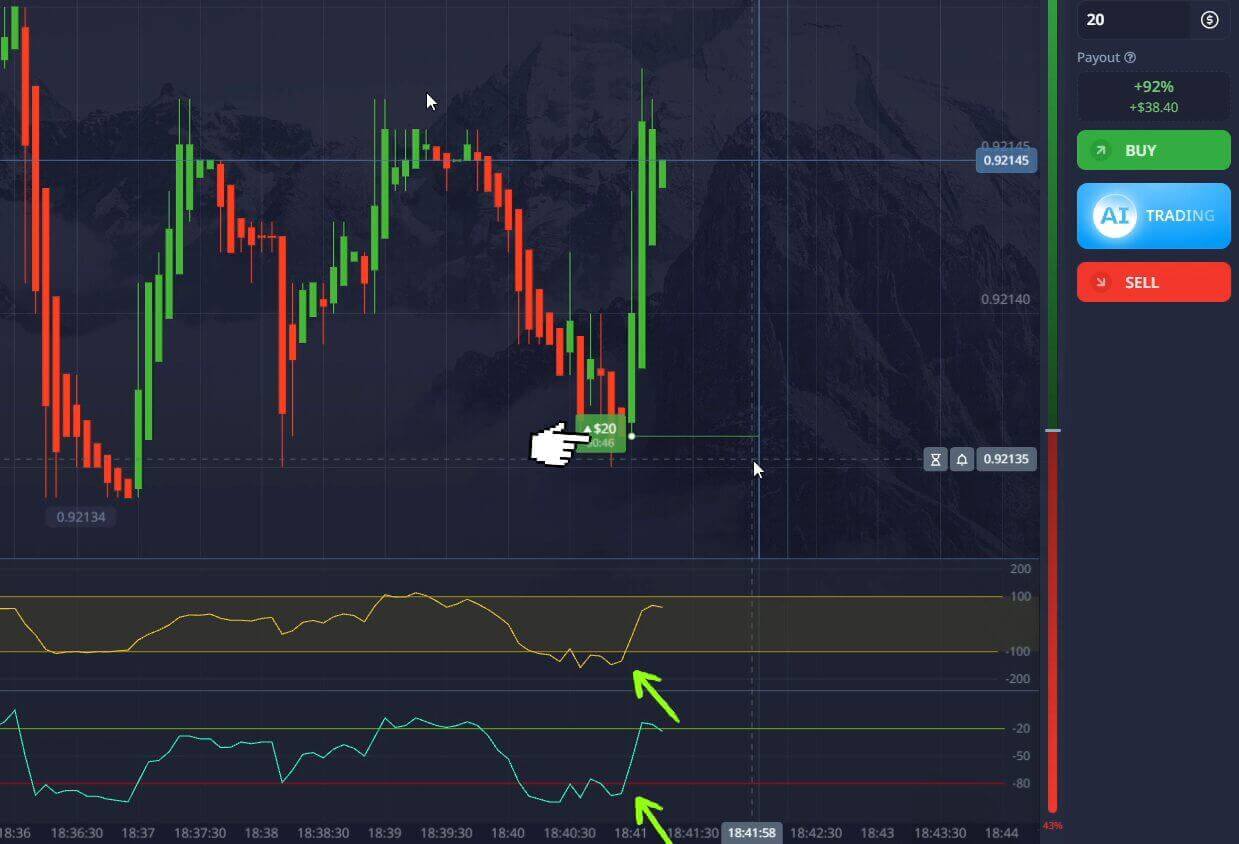
- CCI: period 14, levels at +100 and −100.
- Williams %R: period 14, levels at −20 and −80.
- Filter: a trend or volatility reading of your choice, plus marked support and resistance.
SELL setup: price is at marked resistance, CCI is above +100 and turning down, Williams %R is above −20 and turning down, and your filter is not showing a live uptrend. Enter on the close of a bearish candle.
BUY setup: price is at marked support, CCI is below −100 and turning up, Williams %R is below −80 and turning up, and your filter is not showing a live downtrend. Enter on the close of a bullish candle.
Stand aside: the oscillators are stretched but the filter says a trend is running, the candle has not closed, or price is mid-range with no level nearby. Note the word turning in both rules — a stretched reading on its own is not the signal; the roll-over is.
Risk Management and Practice
Because this setup fails hardest when it looks strongest, position sizing does more work here than the indicators do. Stake a small fixed fraction of your balance per trade rather than sizing up after a loss, cap your trades per session, and stop at a preset daily loss limit. Avoid the minutes around major news. Run the rules on a demo account until you can spot the trending-and-stretched case on sight — that single skill is what separates this from clicking every ±100 cross.

 Unlock Indicator Settings
FAQ
Is the "1 minute trick" a way to beat the platform?
No. It is a nickname for a fast oscillator read, nothing more. No setup wins every trade, and losing trades are a normal part of short-expiry trading. Treat a signal as a prompt to check your context, not as an instruction.
Do I need both CCI and Williams %R?
Not strictly. They overlap heavily, so running both mainly gives you a clearer visual read of the same idea. If you want a genuine second opinion, add something that measures direction or volatility instead of a third oscillator. Broader risk framing is covered in this Pocket Option risk trading guide.
Where do I get the exact indicator settings and templates?
The ready-made templates and the wider strategy set are bundled with the single $39 lifetime plan, which also covers every other indicator on the site. The core settings above are enough to build the setup manually on any charting package.
⬇️ Get ALL of this Pocket Option Strategies + This Strategy Settings ⬇️
 Unlock Indicator Settings
This content is for educational purposes only. Trading involves risk. Past results do not guarantee future outcomes. Always practice responsible money management and limit your daily trades to avoid large losses.