EMA Crossover Strategy on IQ Cent
An EMA crossover is one of the most-used momentum setups on fast binary options platforms like IQ Cent, and it is popular for a good reason: it turns a fuzzy question — is momentum turning? — into a single, visible event on the chart. This guide walks through what the crossover actually plots, the settings we run, how to read an entry, and, just as important, the market conditions where the signal breaks down. Read this first: a crossover is a lagging signal. The cross prints after a move has already begun, so it confirms momentum rather than predicting it. Treat it as decision support, not a promise.
What the EMA Crossover Plots
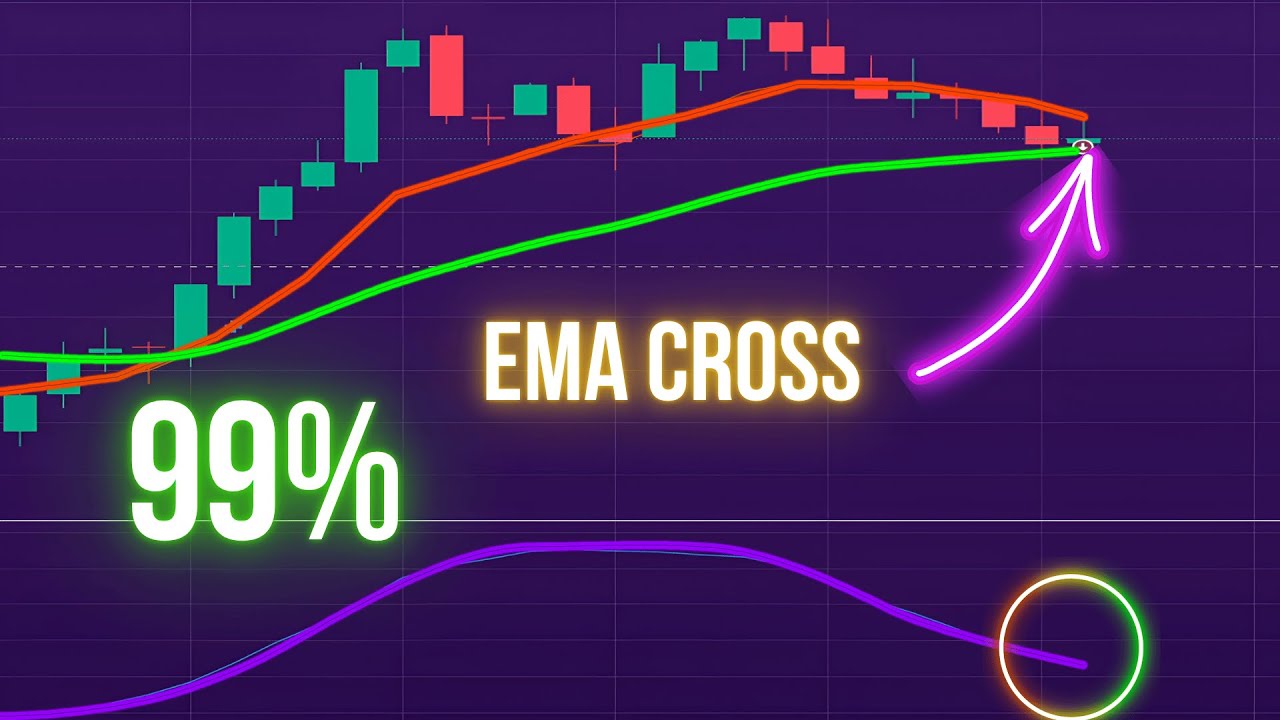
You plot two exponential moving averages: a fast EMA that hugs price closely and a slow EMA that reacts more slowly. When the fast EMA climbs through the slow EMA from below, the two lines form a "plus" shape and the market is shifting toward the upside. When the fast EMA drops through the slow EMA from above, momentum is shifting to the downside. Because an EMA weights recent candles more heavily than a simple moving average, it reacts a little faster — but it is still built from closed prices, so the cross always lags the actual turn. That lag is the trade-off you accept in exchange for a clear, objective signal.
Recommended Settings
Our default on IQ Cent is a 9-period fast EMA crossing a 26-period slow EMA, read on a short intraday chart. Faster pairings such as 5/10 react sooner but whipsaw more; slower pairings such as 9/21 are calmer but lag more — there is no free lunch, only the balance you prefer. Some traders add the Coppock Curve (Length 10, Long ROC 14, Short ROC 11) underneath as a second opinion: a Coppock line turning up from a low level agrees with an up-cross, while a Coppock already stretched high warns that the move may be late. Keep the chart clean, trade a small set of liquid pairs you know well, and let each candle fully close before you act on a cross.
Entry Rules
The rules are deliberately simple so you can apply them calmly inside a short expiry window:
- Call (up): the fast EMA crosses up through the slow EMA on a closed candle, the broader trend is already pointing up, and price is holding above the recent swing low.
- Put (down): the fast EMA crosses down through the slow EMA on a closed candle, the broader trend is pointing down, and price is failing under recent resistance.
- Stand aside: the cross happens while price is drifting sideways with no clear direction, or trend context disagrees with the cross. When in doubt, wait for the next clean signal.
Notice that every entry asks for trend context and a closed candle. Skipping those two filters is what separates reading the crossover from blindly clicking every cross.
When the EMA Crossover Fails
The crossover’s weakness is the flat market. In a range, price chops back and forth across both EMAs, printing cross after cross — up, down, up again — and most of those crosses lead nowhere. This is called a whipsaw, and it is the single biggest way a crossover strategy bleeds. The defence is context: only take crosses that fire in the direction of a visible trend, and stand aside when the two EMAs are tangled together and flat. If you cannot tell which way the market is leaning, the crossover cannot tell you either. Fewer, cleaner signals in trending conditions beat trading every cross in a range.
If you want to compare crossover variations, see our 5 Pocket Option EMA strategies, the faster 4-EMA crossover for 5-second expiry, and this look at using three EMA lines for short-term trading. Every indicator on the site is included with one $39 lifetime plan.
FAQ
Is the EMA crossover a leading or lagging signal?
It is a lagging signal. Both EMAs are built from closed prices, so the cross confirms that momentum has already begun to shift rather than predicting the turn in advance. That is why trend context and a fully closed candle matter before you act on any cross.
Why does the crossover give so many false signals?
Almost always because the market is ranging. In a sideways market price whips back and forth across both EMAs and produces crosses that lead nowhere. Take crosses only in the direction of a clear trend and stand aside when the EMAs are flat and tangled.
What settings should I start with on IQ Cent?
A 9/26 EMA pairing is a sensible starting point, optionally with the Coppock Curve as a confirmation filter. Test it on a demo account until the reads feel automatic, and remember every tool here is part of the single $39 lifetime plan.
This content is for educational purposes only. Trading involves risk. Past results do not guarantee future outcomes. Always practice responsible money management and limit your daily trades to avoid large losses.