Expert Option Trading with Awesome Oscillator
Short-expiry trading on Expert Option compresses a decision into seconds: higher or lower when the timer runs out? The Awesome Oscillator (AO) suits that window because it turns momentum into one histogram you can read at a glance. Here is what it calculates, how to read it, and where it fails.
What the Awesome Oscillator Actually Measures
The AO is not a trend indicator and not an overbought/oversold gauge. It is a momentum difference. It takes the median price of each candle (high plus low, divided by two), builds a fast and a slow simple moving average of it, and plots the fast SMA minus the slow SMA as a histogram around a zero line. Bill Williams' original specification uses a 5-period fast SMA and a 34-period slow SMA. That is the whole formula.
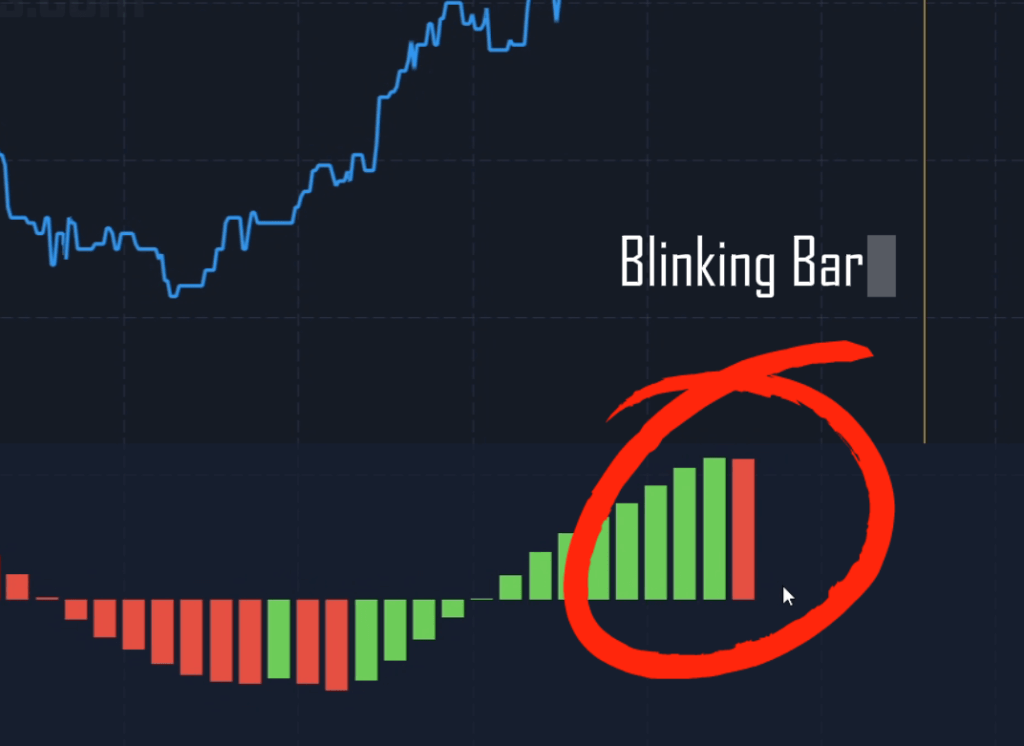
So the histogram tells you one thing: whether recent momentum is stronger or weaker than the longer baseline. Bars above zero mean the fast average sits above the slow one. Bars turn green when the current bar is taller than the previous one and red when shorter, so colour describes the change in momentum, not direction — a green bar below zero means the market is still falling, but less hard than before.
Reading the Histogram: Zero Cross, Twin Peaks, Saucer
- Zero-line cross: the fast average overtaking the slow one. The most obvious of the three reads, and on a very short chart it arrives late.
- Twin peaks: two peaks on the same side of zero where the second is smaller, with no zero cross between them. A failing push: the market tried again and could not generate the same force.
- Saucer: a run of bars on one side of zero that shrinks then expands again — three shortening red bars followed by a green bar, all above zero. The method below builds on this: the colour flip is the AO's earliest signal.
Setup and Settings for Short Expiries
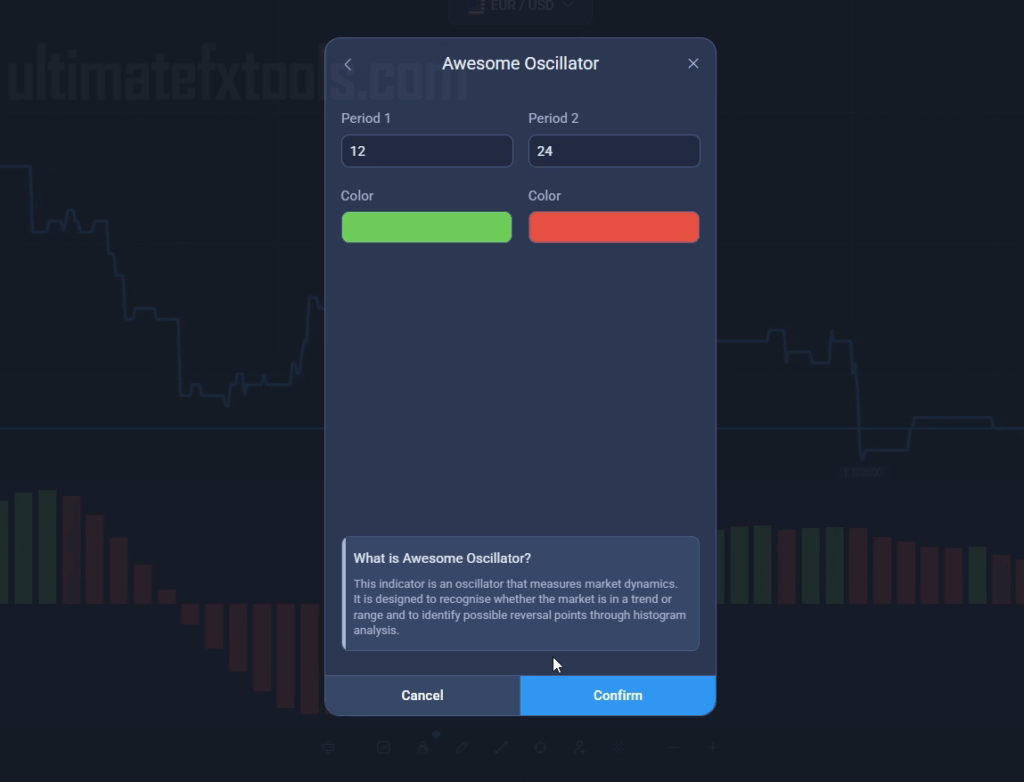
- Awesome Oscillator periods: 12 fast, 26 slow. Slower than the 5/34 default, which is the point — on a 5-second chart the defaults flip on almost every tick. Prefer classic 5/34? Read it on a slower chart.
- Chart type: a LINE chart rather than candles — less noise at this speed.
- Timeframe: 5-second, or 1-second if your connection is genuinely fast.
- Expiry: 20-60 seconds, matched to the chart you read the signal on.
- Risk per trade: 0.5-1% of capital, fixed, decided before you start.
Entry Logic and Confirmation
This trades momentum exhaustion, not trend continuation:
- Identify momentum: wait for three or more consecutive AO bars of one colour. Fewer is noise.
- Enter on the flip: take the first opposing-colour bar. Green to red points down; red to green points up.
- Confirm first: the flip alone is weak. Was the run shrinking into it (a saucer, not a random bar)? Is price stalling at a recognisable level? Is the histogram near an extreme rather than hugging zero? If not, skip it.
- Set expiry: 20-30 seconds when the run into the flip was long and clearly decaying; 45-60 seconds when the read needs more room.
When the Awesome Oscillator Fails
The failure modes matter more than the entry. The AO lags by construction — built from moving averages, it only describes momentum that has already happened. In a strong trend it produces colour flips that look like reversals but are simply pauses; fading a trend on a 20-second expiry is how accounts get drained. Around news releases the median price gaps and the histogram is meaningless. In a flat market the bars hover near zero and every flip is noise. And on 1-5 second charts the last bar is still forming — it can change colour before it closes, so a flip you acted on may not exist a second later.
The guardrails: stop after three consecutive losses, avoid news windows, keep a trading journal, and demo test thoroughly before risking real money. Consistency comes from skipping bad conditions, not catching signals.
Related reading: binary options with the Awesome Oscillator and Momentum, a slower variation using Awesome Oscillator with Bears Power and ZigZag, and a different short-expiry approach in Expert Option mobile trading with RSI and EMA.
FAQ
Why 12 and 26 instead of the standard 5 and 34?
On a 5-second chart the default 5/34 averages cover a handful of seconds and flip constantly. The longer 12/26 pair smooths the histogram so a colour change carries more information. Neither is inherently better — they solve one problem at different speeds.
Can the Awesome Oscillator be used on its own?
It can, but a momentum histogram alone gives no context about level, trend or volatility. Most traders add a trend filter or a support and resistance read, so flips against the dominant move get skipped. Every indicator on this site comes with the single $39 lifetime plan.
Does the AO work on other platforms?
Yes. The AO is standard on MetaTrader and most trading platforms, including IQ Option, Quotex and Pocket Option. The formula and the three patterns are identical everywhere; only chart speeds and expiry options differ.
This content is for educational purposes only. Trading involves risk. Past results do not guarantee future outcomes. Always practice responsible money management and limit your daily trades to avoid large losses.