Best 2 Trading Indicators for Winning Trade
Despite the name that has followed this setup around the web, this is not a "hack" and there is no secret switch that beats the market. It is simply a clear, rule-based approach for short-term IQ Option trades that combines two well-known technical tools: the Average True Range (ATR) and Bollinger Bands. Used together, they help you read short-term momentum and volatility, filter noise, and wait for the kind of setup that has a reasonable chance of moving in your favour.
Before we go further, an honest note: no strategy wins every trade, and any setup that promises otherwise is misleading. What a good rule-based method gives you is consistency — the same entry logic applied the same way each time, so your decisions come from the chart rather than emotion. Treat every position as risk, size it small, and judge the approach over many trades rather than a single result.
How the ATR and Bollinger Bands Strategy Works
Bollinger Bands wrap price in an upper and lower band that expand when the market is volatile and contract when it is quiet. The ATR measures how much price is moving on average, so it acts as a momentum filter on top of the bands. When these two agree — price stretching toward a band while ATR confirms real movement rather than a flat, dead market — you have a candidate setup. When the bands are pinched tight and ATR is low, the market is drifting and it is usually better to stand aside, since short-expiry trades tend to struggle in choppy conditions.
Recommended Indicator Settings
These are sensible starting values. Adjust them to the pair and the current market rather than treating them as fixed rules.
ATR Indicator:
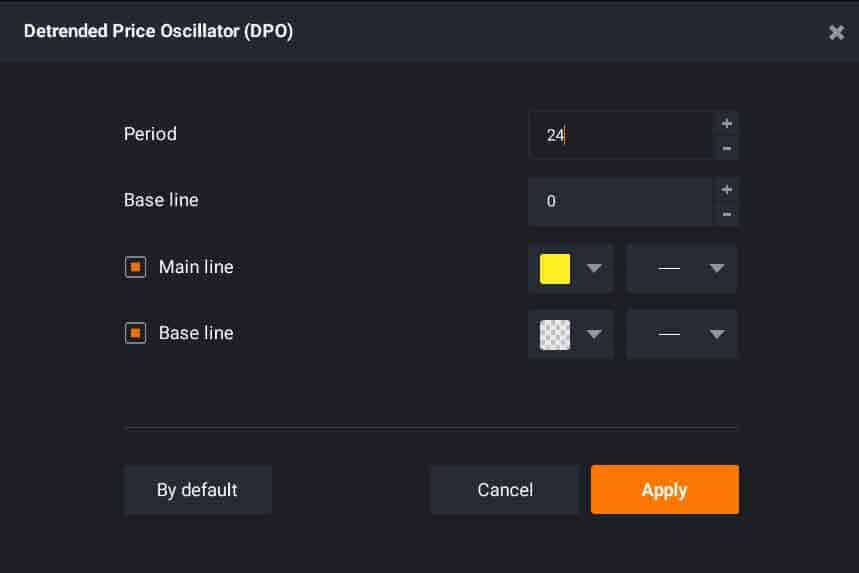
- Period: 13
- Offset: 3
- Source: Close
Bollinger Bands:
- Period: 14
- Standard Deviation: 2
For Bollinger Bands, many traders remove the middle line or set its transparency to zero so the chart stays clean and the outer bands are easier to read. If you like the ATR-based approach, the companion setup in our IQ Option ATR and Aroon guide shows how a second confirming indicator can be layered on top for extra filtering.
Buy / Call and Sell / Put Rules
Once your chart is set up, the entry logic stays simple and repeatable:
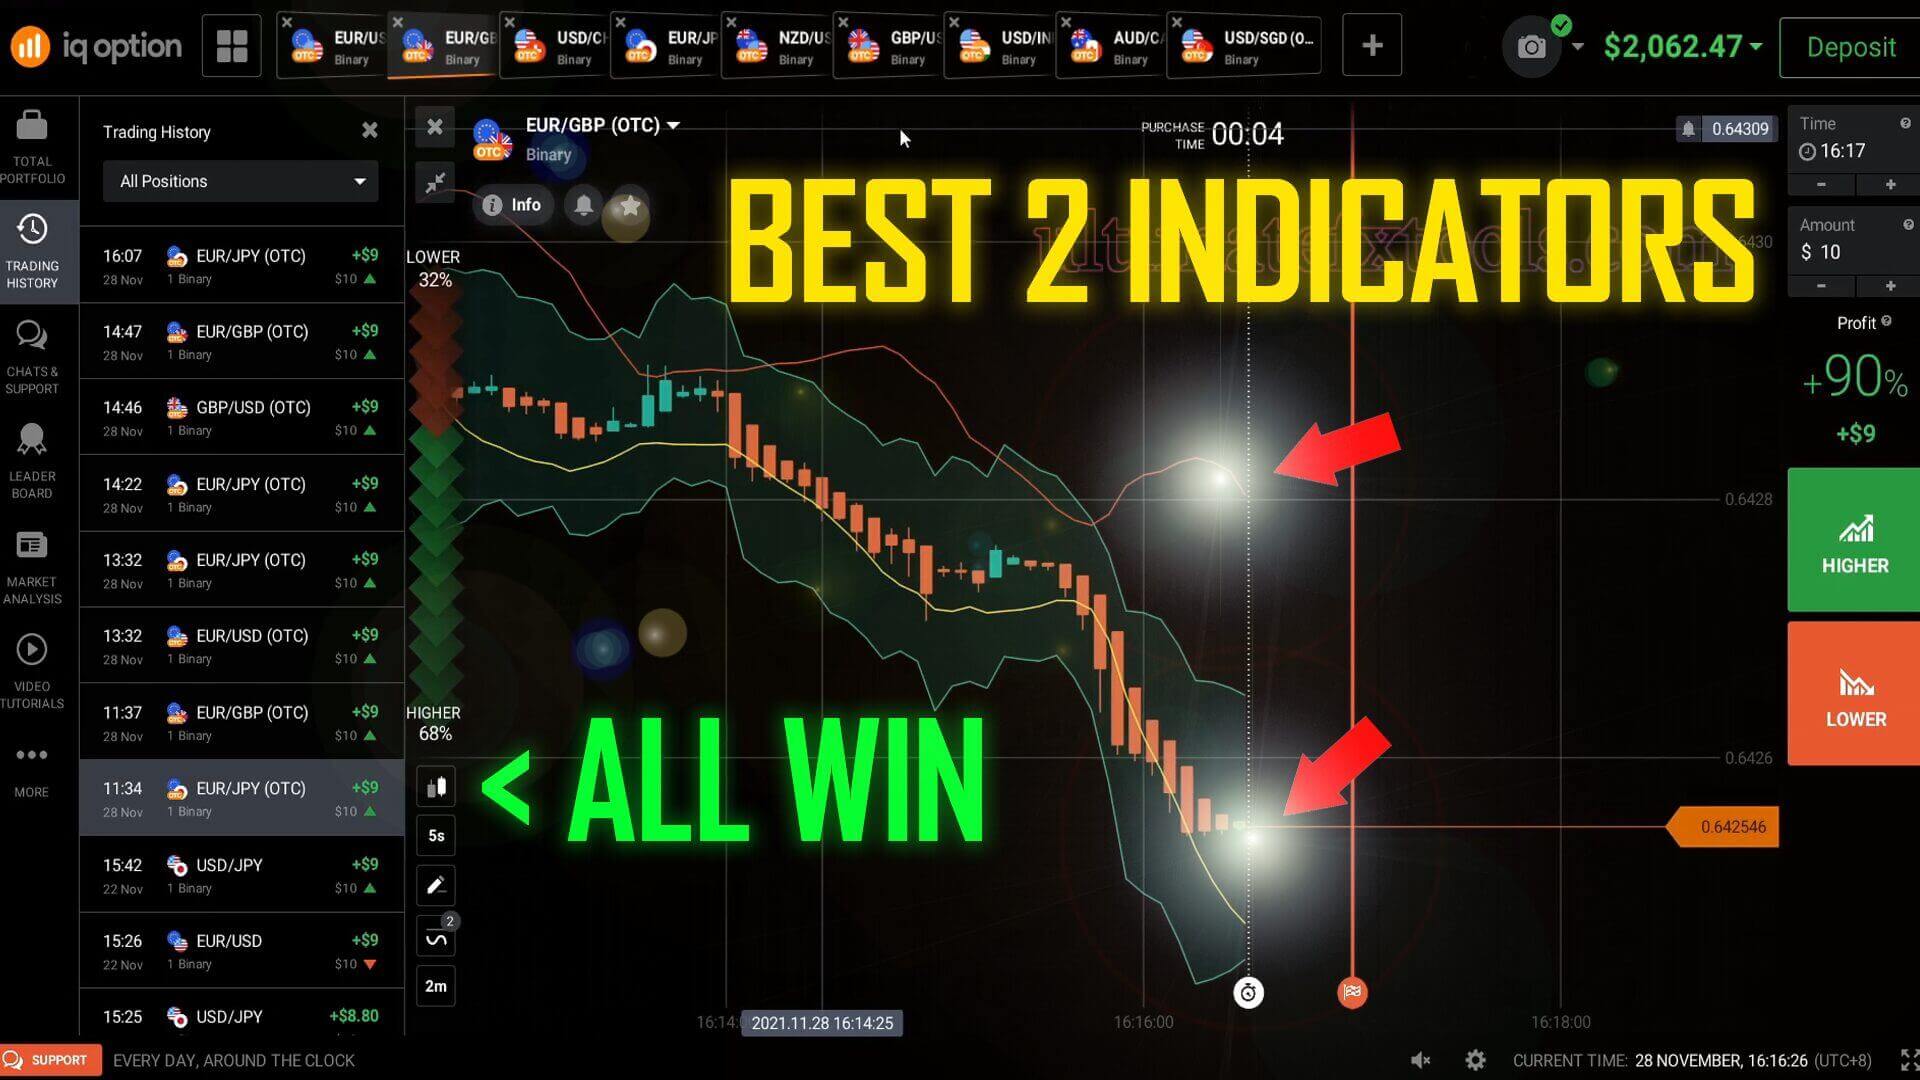
- Call (up) setup: Look for price reaching or crossing the lower Bollinger band while the ATR confirms momentum turning up. A push back toward the middle of the range after touching the lower band suggests buyers are stepping in.
- Put (down) setup: Look for price reaching or crossing the upper Bollinger band while ATR confirms momentum fading. A rejection from the upper band suggests sellers are taking control.
- Skip the trade: If the bands are flat and pinched together with low ATR, there is no clear edge — wait for the next clean setup rather than forcing an entry.
Keep a simple log of each trade so you can fine-tune which conditions work best for you. For a broader look at fast entries, our best 1-minute IQ Option strategy pairs well with this one.
Best Timeframe, Expiry and Risk Management
This setup is designed for short-term charts. A 5-second to 15-second candle with an expiry of 1 to 2 minutes is a common starting point. Start small — a modest fixed stake such as $10 per trade — and keep every position the same size so a losing streak cannot wipe out your balance.
The single most important habit is limiting how many trades you take per day. Set a maximum number of trades and a stop point for both wins and losses, then walk away once you hit it. To see how a disciplined, low-frequency approach is applied on a live chart, the advanced ATR trading walkthrough is a useful next read. And if you want the full library of indicators and tools behind these strategies, review the options on our pricing page.
FAQ
Does this strategy really win every trade?
No. No strategy wins every trade, and this one does not either — the "all win" and "hack" labels are just how the setup became known online, not a promise. The ATR and Bollinger Bands combination is meant to improve the consistency of your entries, but losing trades are a normal part of trading. Focus on disciplined risk management and judge results over many trades, not one.
Which indicators do I need for this setup?
Just two: the Average True Range (ATR) and Bollinger Bands. Both are standard tools available directly inside the IQ Option platform, so no extra downloads are needed to test the approach. Start with the settings listed above and adjust them to the pair you are trading.
What timeframe and expiry work best?
Short-term charts suit this method — try a 5-second to 15-second candle with a 1 to 2 minute expiry. Keep your stake small and fixed, cap your number of trades per day, and avoid trading when the bands are flat and ATR is low, since those quiet conditions offer little edge.
This content is for educational purposes only. Trading involves risk. Past results do not guarantee future outcomes. Always practice responsible money management and limit your daily trades to avoid large losses.