What Is the SFBB (Smoothed Fractal Bollinger Bands) Indicator?
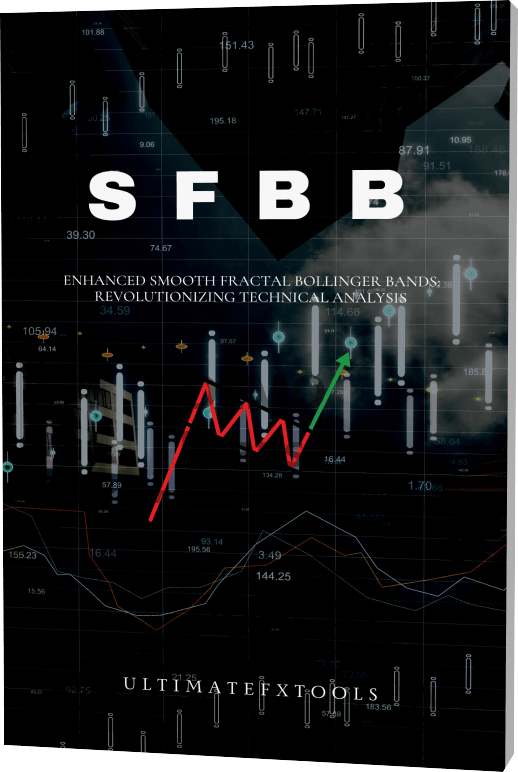
SFBB stands for Smoothed Fractal Bollinger Bands. It takes the familiar Bollinger Bands volatility envelope and applies a fractal-based smoothing pass to the price data before the bands are drawn. The goal is simple: keep the shape of a standard Bollinger study while trimming some of the jitter that makes raw bands hard to read on lower timeframes. It runs as an overlay on MT4, MT5 and TradingView, so it sits directly on your price chart rather than in a separate window.
What SFBB Plots on the Chart
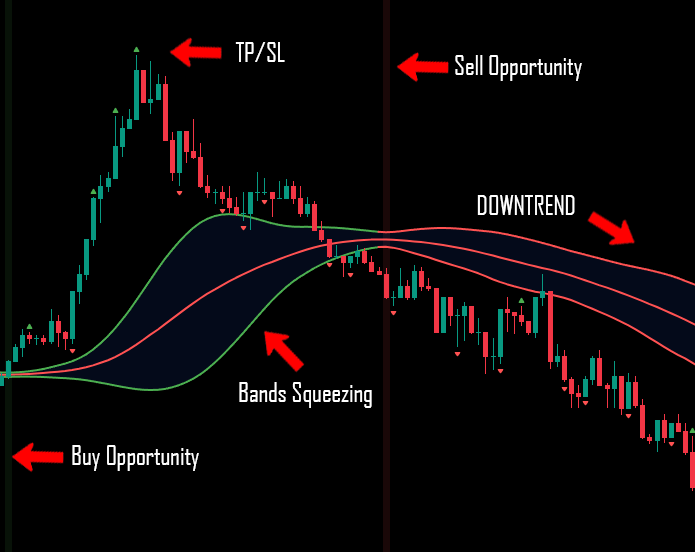
SFBB draws the same three lines you would expect from any Bollinger study: a middle line (a moving average, 20 periods by default), an upper band and a lower band set a number of standard deviations away (2 by default). The difference is that the price feed is smoothed with fractal logic first, so the bands trace a slightly cleaner path. The practical read stays the same:
- The bands widen when volatility rises and the market is moving quickly.
- The bands squeeze together when the market is quiet and range-bound, which often precedes a larger move.
- The middle line acts as a moving reference for the prevailing direction.
Because everything is built from a moving average, SFBB is a lagging tool. It describes what volatility has recently done, not what price will do next. Treat it as context, not a crystal ball.
A Band Touch Is Not a Signal by Itself
The most common mistake with any Bollinger-style tool is selling every time price tags the upper band and buying every time it tags the lower band. In a strong trend, price can ride a band for a long stretch, printing touch after touch while the move continues. A touch tells you price has reached the edge of its recent volatility range, nothing more. What matters is what happens next: does price reject the band and turn, or does it close outside and keep going? SFBB helps you frame that question, but it does not answer it on its own.
How to Add SFBB and Suggested Settings
On MT4 or MT5, drop the compiled indicator file into the MQL4/Indicators or MQL5/Indicators folder, restart the platform, then drag SFBB from the Navigator onto your chart. On TradingView, add the study from your indicators list and it overlays automatically. Sensible starting values:
- Period: 20 (the standard Bollinger length). Shorter reacts faster but whipsaws more; longer is smoother but slower.
- Deviations: 2.0 standard deviations for the outer bands. Widen to 2.5 to see fewer touches, tighten to 1.5 for more.
- Applied price / smoothing: leave the fractal smoothing on its default so the bands stay legible without lagging further than necessary.
Change one setting at a time and watch how the bands respond before committing to it on a live chart.
How to Confirm SFBB Reads
Because SFBB is a volatility envelope, it pairs best with a separate momentum or trend tool that tells you direction. Line it up against a moving-average read like the one in our Bollinger Bands and MA setup, or a momentum oscillator, so a band rejection is only acted on when the second tool agrees. A squeeze that resolves in the direction your confirmation tool is already leaning is a far cleaner read than a lone band touch. For deeper background on reading the envelope itself, see our guide to the 5 uses of Bollinger Bands in trading, and if you want to combine bands with fractal turning points, the fractal indicator with Alligator walkthrough covers the fractal side in more detail.
When SFBB Fails
SFBB struggles in two situations. First, in a strong trend it will keep price pinned to one band, so anyone fading every touch gets run over. Second, during a low-volatility drift the bands squeeze so tightly that ordinary noise pushes price back and forth across them, producing touches that mean nothing. In both cases the smoothing helps the bands look cleaner but does not remove the lag. Knowing these blind spots is what turns SFBB from a signal generator into a genuine context tool used with more consistency.
FAQ
Is SFBB different from normal Bollinger Bands?
Structurally it is the same envelope: a moving-average middle line with upper and lower deviation bands. The difference is that SFBB smooths the price input with fractal logic before drawing the bands, which reduces some visual noise. It does not change the underlying math or remove the built-in lag.
Can I use SFBB on MT4, MT5 and TradingView?
Yes. SFBB is an overlay indicator that runs on all three. On MetaTrader you install the file into the Indicators folder; on TradingView you add it as a study. It is bundled with every other tool on the site under a single $39 lifetime plan.
Does touching a band mean I should trade?
No. A band touch only shows price has reached the edge of its recent volatility range. Price can ride a band throughout a trend. Always confirm with a direction tool and manage risk on every position before acting on a touch.
This content is for educational purposes only. Trading involves risk. Past results do not guarantee future outcomes. Always practice responsible money management and limit your daily trades to avoid large losses.